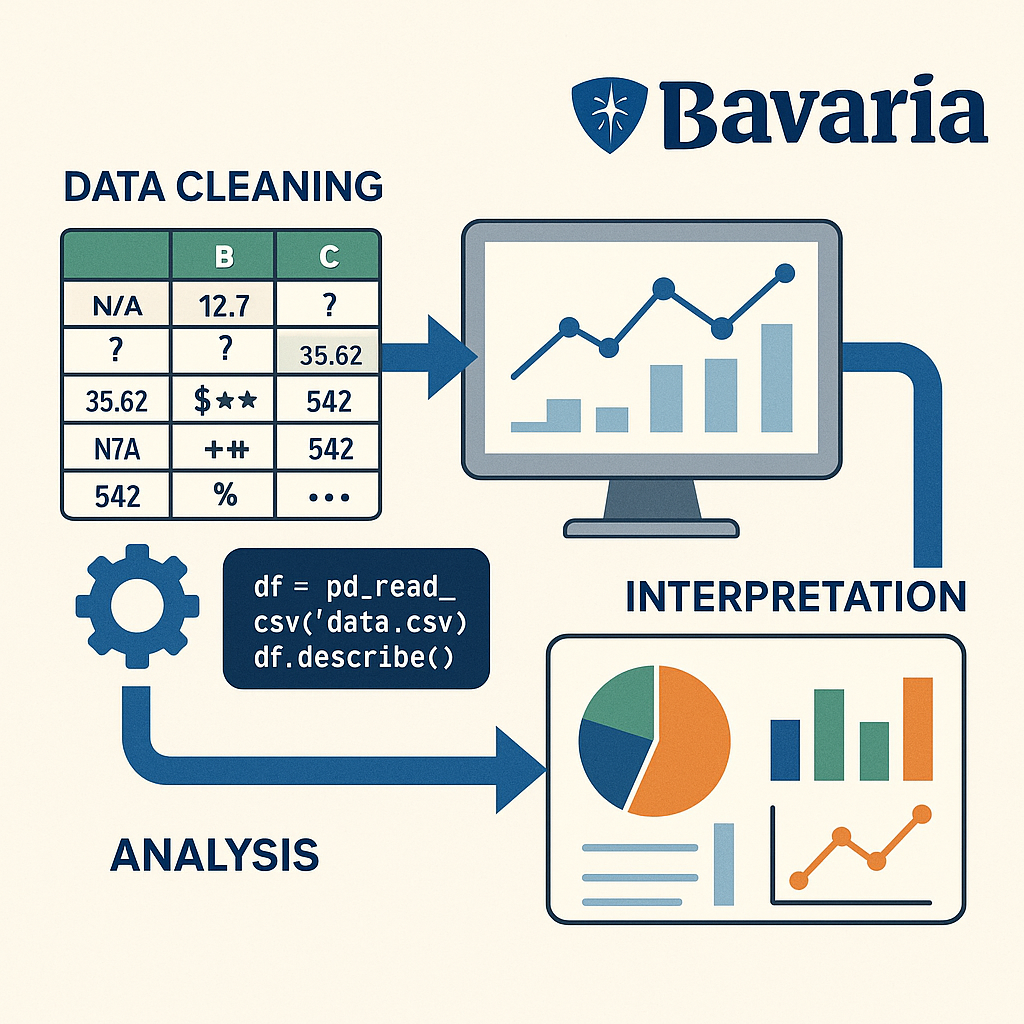
Data Cleaning & Analysis with Bavaria
This project was developed in collaboration with Bavaria, focusing on transforming raw, messy datasets into clean, structured insights for informed decision-making. The project highlights the power of data preparation and exploratory analysis in supporting real-world operations.
Project Focus
The goal was to clean inconsistent and incomplete company data, analyze patterns and trends, and interpret the findings to support business optimization. Due to confidentiality, specific datasets and outcomes are not disclosed.
Methods & Tools
1. Data Cleaning
Handled missing values, normalized formats (dates, units), removed duplicates, and detected outliers using statistical methods.
2. Exploratory Data Analysis (EDA)
Analyzed univariate and bivariate distributions, created correlation heatmaps, and broke down time-series trends.
3. Data Interpretation & Reporting
Created dashboard-style visualizations and extracted key metrics related to seasonality, bottlenecks, and operational inefficiencies.
Technologies Used
- Python: Pandas, NumPy, Scikit-learn, Matplotlib, Seaborn
- BI Tools: PowerBI
- Environment: Jupyter Notebooks
- Version Control: Git
“You can’t model what you haven’t cleaned. You can’t optimize what you haven’t understood.”